import numpy as np
import matplotlib.pyplot as plt
t = np.linspace(0, 10, 500)
x = np.exp(-0.4*t)*np.cos(3.0*t)
fig, ax = plt.subplots()
ax.plot(t, x)
ax.set_xlabel("tempo (s)"); ax.set_ylabel("posizione")
plt.show()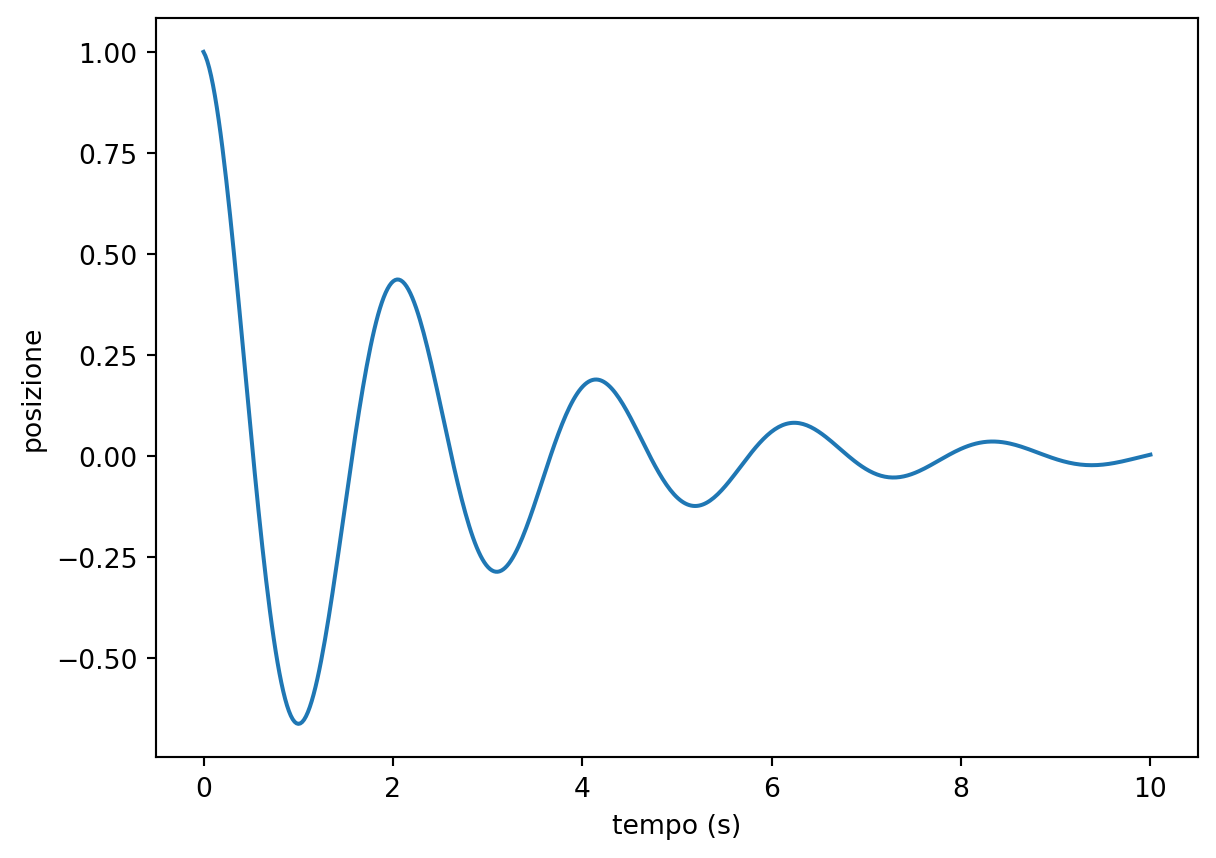
L’ampiezza di un oscillatore smorzato decade nel tempo secondo:
\[ x(t) = e^{-\gamma t}\cos(\omega t) \]
import numpy as np
import matplotlib.pyplot as plt
t = np.linspace(0, 10, 500)
x = np.exp(-0.4*t)*np.cos(3.0*t)
fig, ax = plt.subplots()
ax.plot(t, x)
ax.set_xlabel("tempo (s)"); ax.set_ylabel("posizione")
plt.show()